Project
Details
More project information.
Shared data and results available are linked.
Great Lakes Runoff Intercomparison Project for Lake Erie (GRIP-E)
This study is the third in a sequence of the Great Lakes Runoff Intercomparison Projects. The densely populated Lake Erie watershed studied here is an important international lake that has experienced recent flooding and shoreline erosion alongside excessive nutrient loads that have contributed to lake eutrophication. Understanding the sources and pathways of flows is critical to solve the complex issues facing this watershed. Seventeen hydrologic and land-surface models of different complexity are set up over this domain using the same meteorological forcings, and their simulated streamflows at 46 calibration and seven independent validation stations are compared. Results show that: (1) the good performance of Machine Learning models during calibration decreases significantly in validation due to the limited amount of training data; (2) models calibrated at individual stations perform equally well in validation; and (3) most distributed models calibrated over the entire domain have problems in simulating urban areas but outperform the other models in validation.
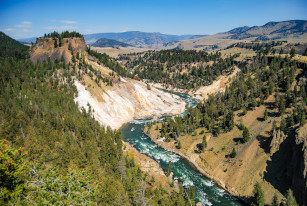
Figure:
Domain modelled within the GRIP-E project including 17
models setup and compared at 46 calibration stations and
7 validation stations as presented in Mai et al. (2021).
The work has been published in:
Mai, Tolson, Shen, Gaborit, Fortin, Gasset, et al. (2021).
Great Lakes Runoff Intercomparison Project Phase 3: Lake Erie (GRIP-E).
Journal of Hydrologic Engineering, 26(9), 05021020.
(link)
The data and codes are published under Zenodo. More details, codes, data and setups can be found on GitHub and its associated Wiki. Interactive maps showing the results are coming soon....
Great Lakes Runoff Intercomparison Project for the entire Great Lakes watershed (GRIP-GL)
This study
is the fourth in a sequence of the Great Lakes Runoff
Intercomparison Projects covering the entire Great Lakes
watershed after the predecessors focussed on in
individual lakes (Michigan, Ontario, and Erie). This study brought together a wide range of
researchers setting up their models of choice in a highly
standardized experimental setup using the same geophysical datasets,
forcings, common routing product, and locations of performance
evaluation across the 1 million square kilometer study domain. The
study comprises 13 models covering a wide range of model types from
Machine Learning based, basin-wise, subbasin-based, and gridded
models that are either locally or globally calibrated or calibrated
for one of each of six predefined regions of the watershed. Unlike
most hydrologically focused model intercomparisons, this study not
only compares models regarding their capability to simulated
streamflow (Q) but also evaluates the quality of simulated actual
evapotranspiration (AET), surface soil moisture (SSM), and snow
water equivalent (SWE). The latter three outputs are compared
against gridded reference datasets. The comparisons are performed in
two ways: either by aggregating model outputs and the reference to
basin-level or by regridding all model outputs to the reference grid
and comparing the model simulations at each grid-cell.
The main results of this study are:
(1) The comparison of models regarding streamflow reveals the
superior quality of the Machine Learning based model in all
experiments performance; even for the most challenging
spatio-temporal validation the ML model outperforms any other
physically based model.
(2) While the locally calibrated models lead to good
performance in calibration and temporal validation (even
outperforming several regionally calibrated models), they lose
performance when they are transferred to locations the model has not
been calibrated on. This is likely to be improved with more advanced
strategies to transfer these models in space.
(3) The regionally calibrated models - while losing less
performance in spatial and spatio-temporal validation than locally
calibrated models - exhibit low performances in highly regulated
and urban areas as well as agricultural regions in the US.
(4) Comparisons of additional model outputs (AET, SSM, SWE)
against gridded reference datasets show that aggregating model
outputs and the reference dataset to basin scale can lead to
different conclusions than a comparison at the native grid
scale. The latter is deemed preferable; especially for variables
with large spatial variability such as SWE.
(5) A multi-objective-based analysis of the model performances
across all variables (Q, AET, SSM, SWE) reveals overall excellent
performing locally calibrated models (i.e., HYMOD2-lumped) as well
as regionally calibrated models (i.e., MESH-SVS-Raven and
GEM-Hydro-Watroute) due to varying reasons. The Machine Learning
based model was not included here as is not setup to simulate AET,
SSM, and SWE.
(6) All basin-aggregated model outputs and observations for
the model variables evaluated in this study are available on an
interactive website that enables users to visualize results and
download data and model outputs.
Figure:
The six main regions of the study domain, i.e., the Lake Superior region, the Lake
Michigan region, the Lake Huron region, the lake Erie
region, the Ottawa River region, and the Lake Ontario
watershed.
The work is published in:
Mai, J., Shen, H., Tolson, B. A., Gaborit, E., Arsenault, R.,
Craig, J. R., Fortin, V., Fry, L. M., Gauch, M., Klotz, D.,
Kratzert, F., O'Brien, N., Princz, D. G., Rasiya Koya, S., Roy,
T., Seglenieks, F., Shrestha, N. K., Temgoua, A. G. T., Vionnet,
V., and Waddell, J. W. (2022).
The Great Lakes Runoff Intercomparison Project Phase 4: The Great Lakes (GRIP-GL).
Hydrol. Earth Syst. Sci., 26, 3537–3572. Highlight paper. Accepted Jun 10, 2022.
(link)
The data and codes are deposited in the Federated Research Data Repository. A description of these deposited data is described in a README. The thumbnail images for GRIP-GL are available for download as well (grip-gl_thumbnail_images.zip). The following interactive maps show the model simulations and performances of streamflow, actual evapotranspiration, surface soil moisture, and snow water equivalent presented in the study. Data can be downloaded for each station on those websites.
-

Streamflow simulations
The following map will display the results of streamflow simulations of the 13 participating models. The results can be displayed as hydrographs for each of the 212 streamflow locations (141 calibration locations and 71 validation locations) for either the calibration period (Jan 2001 to Dec 2010) or the validation period (Jan 2011 to Dec 2017).
-
Actual evapotranspiration
The following map displays the simulated actual evapotranspiration of twelve of the 13 participating models; the Machine Learning based ML-LSTM-lumped model did not simulate this variable. The simulations (Jan 2001 to Dec 2017) are compared to the GLEAM v3.5b evapotranspiration (variable 'E' in dataset). Only the basin-wise simulations and comparisons are available on the webpage.
-
Surface soil moisture
The following map displays the simulated (standardized) surface soil moisture of twelve of the 13 participating models; the Machine Learning based ML-LSTM-lumped model did not simulate this variable. The simulations (Jan 2001 to Dec 2017) are compared to the GLEAM v3.5b surface soil mositure (variable 'SMsurf' in dataset). Only the basin-wise simulations and comparisons are available on the webpage.
-
Snow water equivalent
The following map displays the simulated snow water equivalent of twelve of the 13 participating models; the Machine Learning based ML-LSTM-lumped model did not simulate these variable. The simulations (Jan 2001 to Dec 2017) are compared to the ERA5-Land snow water equivalent (variable 'sd' in dataset). Only the basin-wise simulations and comparisons are available on the webpage.
Nelson-Churchill Intercomparison Project (Nelson-MIP)
Intercomparison studies play an important, but limited role in understanding the usefulness and limitations of currently available hydrological models. Comparison studies are often limited to well-behaved hydrological regimes, where rainfall-runoff processes dominate the hydrological response. These efforts have not covered western Canada due to the difficulty in simulating that region’s complex cold region hydrology with varying spatiotemporal contributing areas. This intercomparison study is the first of a series of studies under the intercomparison project of the international and interprovincial transboundary Nelson-Churchill River Basin (NCRB) in North America (Nelson-MIP), which encompasses different ecozones with major areas of the non-contributing Prairie potholes, forests, glaciers, mountains, and permafrost. The performance of eight hydrological and land surface models is compared at different unregulated watersheds within the NCRB. This is done to assess the models’ streamflow performance and overall fidelity without and with calibration, to capture the underlying physics of the region and to better understand why models struggle to accurately simulate its hydrology. Results show that some of the participating models have difficulties in simulating streamflow and/or internal hydrological variables (e.g., evapotranspiration) over Prairie watersheds but most models performed well elsewhere. This stems from model structural deficiencies, despite the various models being well calibrated to observed streamflow. Some model structural changes are identified for the participating models for future improvement. The outcomes of this study offer guidance for practitioners for the accurate prediction of NCRB streamflow, and for increasing confidence in future projections of water resources supply and management.
Figure:
The domain of the Nelson-Churchill River Basin studied in the
model intercomparison Nelson-MIP. The stations compared are
highlighted with markers. ![]()
The work is published in:
Ahmed, M. , Stadnyk, T. , Pietroniro, A. , Awoye, H. , Bajracharya,
A. , Mai, J. , Tolson, B. , Shen, H. , Craig, J. , Gervais, M. ,
Sagan, K. , Wruth, S. , Koenig, K. , Lilhare, R. , Dery, S. , Pokorny,
S. , Venema, H. , Muhammad, A. , Taheri, M. (2023).
Learning From Hydrological Models' Challenges: A Case Study from the Nelson Basin Model Intercomparison Project.
Journal of Hydrology, 623, 129820. Accepted Jun 12, 2023.
(link)
The data and codes are deposited in the Federated Research Data Repository. A description of these deposited data is described in a README.
Hydrologic model intercomparison for Canada
This project establishs a multi-model ensemble of streamflow simulations across Canada, supported by an interactive, open-access web platform hosted through HydroHub. The platform is integrating both physically-based and data-driven models and provide users with tools to visualize pre-defined watershed simulations. Through this, the project advances transparency, reproducibility, collaboration, and accessibility in hydrologic modeling while supporting research, education, and decision-making related to water resources and climate change. This work was supported by collaborations among the University of Waterloo, Ouranos, ETS, and national computing resources.
The following interactive maps show the model simulations and performances of streamflow, actual evapotranspiration, surface soil moisture, and snow water equivalent presented in the study. Data can be downloaded for each station on those websites.
-

Streamflow simulations
The following map will display the results of streamflow simulations of the eight participating models. The results can be displayed as hydrographs for each of the 185 streamflow locations (185 calibration locations and 184 validation locations) for either the calibration period (Jan 2001 to Dec 2015) or the validation period (Jan 1986 to Dec 2000).
-
Actual evapotranspiration
The following map displays the simulated actual evapotranspiration of seven of the eight participating models; the Machine Learning based LSTM model did not simulate this variable. The simulations (Jan 1986 to Dec 2015) are compared to the GLEAM v3.5b evapotranspiration (variable 'E' in dataset). Only the basin-wise simulations and comparisons are available on the webpage.
-
Surface soil moisture
The following map displays the simulated (standardized) surface soil moisture of seven of the eight participating models; the Machine Learning based LSTM model did not simulate this variable. The simulations (Jan 1986 to Dec 2015) are compared to the GLEAM v3.5b surface soil mositure (variable 'SMsurf' in dataset). Only the basin-wise simulations and comparisons are available on the webpage.
-
Snow water equivalent
The following map displays the simulated snow water equivalent of seven of the eight participating models; the Machine Learning based LSTM model did not simulate these variable. The simulations (Jan 1986 to Dec 2015) are compared to the ERA5-Land snow water equivalent (variable 'sd' in dataset). Only the basin-wise simulations and comparisons are available on the webpage.
Hydrologic model intercomparison for North America
This project aims to establish a multi-model ensemble of streamflow simulations across North America, supported by an interactive, open-access web platform hosted through HydroHub. The platform is integrating both physically-based and data-driven models and provide users with tools to visualize hydrologic simulation of watersheds across North America.
The following interactive maps show the model simulations and performances of streamflow, actual evapotranspiration, surface soil moisture, and snow water equivalent presented in the study. Data can be downloaded for each station on those websites.
-
Streamflow simulations
The following map will display the results of streamflow simulations of the eight participating models. The results can be displayed as hydrographs for each of the 2575 streamflow locations for either the calibration period (Jan 2001 to Dec 2015) or the validation period (Jan 1986 to Dec 2000).
-
Actual evapotranspiration
The following map displays the simulated actual evapotranspiration of seven of the eight participating models; the Machine Learning based LSTM model did not simulate this variable. The simulations (Jan 1986 to Dec 2015) are compared to the GLEAM v3.5b evapotranspiration (variable 'E' in dataset). Only the basin-wise simulations and comparisons are available on the webpage.
-
Surface soil moisture
The following map displays the simulated (standardized) surface soil moisture of seven of the eight participating models; the Machine Learning based LSTM model did not simulate this variable. The simulations (Jan 1986 to Dec 2015) are compared to the GLEAM v3.5b surface soil mositure (variable 'SMsurf' in dataset). Only the basin-wise simulations and comparisons are available on the webpage.
-
Snow water equivalent
The following map displays the simulated snow water equivalent of seven of the eight participating models; the Machine Learning based LSTM model did not simulate these variable. The simulations (Jan 1986 to Dec 2015) are compared to the ERA5-Land snow water equivalent (variable 'sd' in dataset). Only the basin-wise simulations and comparisons are available on the webpage.